With a primary focus on technical indicators, our strategy analyzes stocks to identify those with promising potential. We use a balanced combination of analysis methods to ensure our selections are robust and informed.
- Technical Indicators: We identify stocks exhibiting bullish signals across multiple metrics, using several established indicators as the foundation of our selection process.
- Fundamental Analysis: To complement the technical insights, we incorporate fundamental analysis, adding depth and context to our statistical findings.
- Chart Analysis: As further enhancement, we conduct chart analysis, such as examining resistance and support levels, this helps to refine and validate our stock choices and provides users with deeper insights.
- Integrated Insights: By combing the signals of the technical indicators with fundamental, and chart analyses, we ensure that our selections are not only statistically favorable but also informed by market dynamics and trends, offering a comprehensive view of potential investments.
Our integrated strategy offers you several clear advantages:
- Comprehensive Insights: Access detailed analyses that combine fundamentals, market trends, news, and technical aspects.
- Timely Updates: React quickly with efficient notifications about emerging opportunities.
- Informed Decisions: Base your investments on transparent, accurate, and well-structured insights.
- Confident Market Navigation: Understand market dynamics and seize new opportunities with greater certainty.
- Time Efficiency: Save time by receiving ready-to-use analyses without doing extensive research yourself.
- Professional Expertise: Benefit from the experience and research depth of dedicated analysts.
Our service provides you with the following core elements:
- Weekly Trading Alarm
Once a week, you receive a detailed analysis of a selected stock, based on fundamental data, market trends, news, and technical factors. The report gives you a clear overview of why the stock was chosen and what opportunities it may offer.
- Weekly Market Overview
Alongside the stock analysis, you receive a weekly summary of key market developments. This includes major trends, important macroeconomic data, and relevant political or regulatory shifts that could impact sectors or individual stocks.
- Extra Updates on Key Events
In addition to the regular updates, we provide special notifications when major events occur – such as critical news, sector-specific opportunities, unexpected macroeconomic changes, or significant political developments. These updates are sent selectively to keep you informed about high-impact situations.
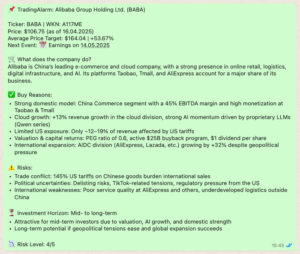
Each TradingAlarm is designed to give you a clear, structured overview of a selected stock, focusing on the most important information for your investment decisions. Every analysis includes the following sections:
- Overview
Basic data such as the stock’s name, ticker, WKN, current price, and average analyst price targets. Also included are upcoming key dates like earnings releases.
- Company Profile
A short, clear description of the company’s business model and market position, summarized in 2–3 sentences.
- Buy Reasons
Key arguments supporting a potential investment. These may include strong fundamentals, positive technical setups, market trends, news events, or valuation highlights.
- Risks
An objective overview of the main risks that could affect the stock’s performance, such as economic factors, political developments, or company-specific issues.
- Investment Horizon and Risk Level
An indication of the expected investment timeframe (short-, mid-, or long-term) and an assigned risk level on a scale from 1 to 5.
In addition, whenever relevant, we briefly mention other stocks that could offer similar opportunities.
An example of a TradingAlarm can be found below.
Fundamental analysis is at the core of our approach, providing a thorough understanding of a company’s financial health, competitive position, and market environment. We combine various information sources to deliver clear and actionable insights.
- Financial and Company Data
We evaluate key metrics such as EBITDA, P/E ratios, and profit margins to assess financial strength and valuation. Corporate updates like earnings results, mergers, leadership changes, and new product developments are also considered.
- News and Seasonal Trends
We monitor relevant news and seasonal factors that may influence industries and individual stocks. Recognizing seasonal patterns helps in timing investment decisions more effectively.
- Market Sentiment
By incorporating analyst opinions and following reputable financial news sources, we gain additional perspectives on market expectations and investor sentiment.
- Economic Events and Macroeconomic Trends
We track major economic indicators such as interest rate decisions, labor market data, and GDP figures, as well as broader macroeconomic and political developments. This context helps to anticipate potential impacts on sectors and companies.
Summary:
Fundamental analysis provides the foundation of our stock selection. Technical indicators are used selectively to support timing decisions, but our main focus remains on understanding company fundamentals, market trends, and broader economic developments.
The information provided is for informational purposes only. It is important to understand how to use it responsibly:
- Purpose:
We offer structured insights to support your investment thinking.
Our information is not direct investment, buying, or selling advice. - Understanding and Independent Research:
Take time to fully understand the information we provide.
Always conduct your own research before making investment decisions. - Personal Considerations:
Evaluate your own financial situation and investment goals.
Make sure you are aware of your individual risk tolerance. - Responsible Action:
Use our analyses as a helpful basis for your decisions.
Always apply your own judgment and consider your personal situation before acting
While our primary focus lies on fundamentals, market trends, and key news, we also incorporate selected technical indicators to support and refine our analyses. Below is a brief overview of the main tools we reference:
EMA (Exponential Moving Average)
The EMA smooths price data to identify short-, medium-, and long-term trends. We focus on key periods such as 50, 100, and 200, highlighting trend shifts like “golden crosses” and “death crosses.”
MACD (Moving Average Convergence Divergence)
The MACD tracks the relationship between two EMAs to identify momentum changes. Crossovers and divergence patterns help confirm or question trend strength.
RSI (Relative Strength Index)
The RSI measures the speed and magnitude of price movements to detect overbought or oversold conditions. It supports the timing of potential trend reversals.
Stochastic Oscillator
This indicator compares a stock’s closing price to its price range over a certain period. Crossovers in the oversold or overbought zones can suggest trend changes.
OBV (On Balance Volume)
OBV tracks volume flow to confirm the strength of price movements. Divergence between OBV and price trends may signal upcoming reversals.
Summary:
Technical indicators are valuable supportive tools but are never the sole basis for our decisions. We interpret them within the broader context of fundamental factors, market dynamics, and individual investment goals.
You can choose between a monthly, annual, or lifetime subscription.
The monthly plan is priced at 9.90 CHF, the annual plan at 99.00 CHF, and the lifetime access is available for a one-time payment of 299.00 CHF.
The monthly subscription can be canceled at any time.
The annual subscription runs for one year and can be canceled at any time for non-renewal.
Further details about subscription options and pricing can be found in the purchasing section of our website.
Investing in financial markets involves inherent risks, including the potential loss of capital.
The information provided — including analyses, insights, and comments — is for informational purposes only and does not constitute financial advice or recommendations to buy or sell any securities.
All investment decisions should be based on your own knowledge, independent research, and personal financial situation.
If necessary, seek advice from qualified professionals. Always be aware of the risks involved before engaging in trading activities.